I love the stock market and I love FPL. But it is hard to succeed in both of them.
However, there are certain similarities between them that are worth exploring.
In this article, I share my thoughts on some analogies and overlaps and draft some strategies that are used in the stock market/trading that could also be used in Fantasy Football.
Perhaps it will give you some ideas on how to improve your managerial skills in FPL, or at least how to gain at least a small advantage over your rivals.
Let’s dive right in.
Similarities between stock market/trading and fantasy football
Let’s briefly start with some basic, so we could move on to some more complex ideas swiftly.
1. Finding undervalued (underperforming) assets with Fundamental Analysis
In Fantasy Premier League, the ultimate goal is to maximize the total points scored by the team.
The main goal in FPL: To maximize the points output
The ultimate goal in the Stock Market or in trading is to maximize the return on investment while managing risk.
The main goal in Financial Market: To maximize profit
This is the crucial understanding. Do not look at similarities between FPL and Stocks in terms of prices. The similarities do not lie in buying players cheap and selling them expensive. No, that is the wrong way of comparing these two entities.
In the financial market, you are looking for undervalued assets (undervalued in terms of their prices), that you want to buy low and sell high in order to maximize profit.
The parallel in FPL is buying undervalued players but not undervalued in terms of price, but undervalued (or more precisely underperforming) in terms of FPL points scored. Basically, you want a player that will bang next, the one that will be the next bandwagon and you want him before he bangs = before everyone else buy him.
But how to identify undervalued players?
Well, this is the most tricky part…
But let’s look if the financial market can give us a clue.
Fundamental Analysis vs xG
If you want to buy undervalued stock (or any other financial instrument), you can identify some by doing a fundamental analysis. Basically, you try to calculate (based on the data from the balance sheet, market cap, and comparison with other similarly sized companies) the Intrinsic value of the stock – the “expected” price of the stock based on your analysis.
And if the real price is below the intrinsic value, you buy the stock, because you think it is undervalued and the price should catch up with its value soon.
(Similarly, if the real price is above the intrinsic value, you sell (or go short) the stock, because you think it is overvalued and the price should decline).
Of course, the risk is that you might have miscalculated the instructive value and be totally wrong…
But you get the idea.
And then when the price hits your target, or the price catches up to perceived value, you sell the stock because it is no longer undervalued and book a profit (or a loss if you were wrong).
How to use fundamental analysis in FPL?
In FPL, we could find underperforming players by looking at stats like xG (expected goals), shots etc.
- Usually, if the xG of some player is way lower than the actual goals scored, we do not buy that player because we presume that he is overperforming.
- Similarly, if the xG is higher than his goals scored, we could buy this player because we expect that sum of xG over time will catch up with the actual goals scored
But many times this approach does not work as well as we would wish.
Read more: What is xG and how to use it in FPL?
You can find xG data now in Official FPL statistics or websites like Understat.
2. Trend trading and jumping on bandwagons based on Technical Analysis
Another way how to “catch” a stock that will go up soon is trend trading, which is a part of technical analysis. You use a bunch of indicators (like moving averages, MACDs, stochastic, etc) to identify whether the trend has changed.
But these indicators have delayed, lagging information. They told you the trend changed only when it is already trending in a new direction. They are carrying information from the past. Many times they give you a signal when it is too late.
But here is some example of simple trend indicator on the financial market:
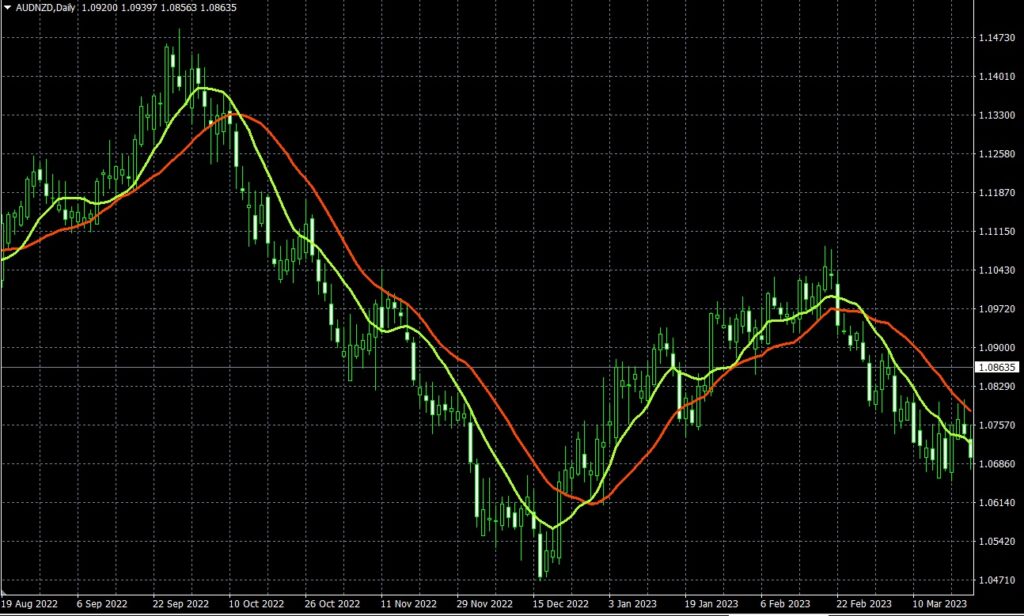
I crossed the chart with two moving averages:
- Fast Moving Average – green line, in this example simple 10-day moving average
- Slow Moving Average – red line, in this example simple 20-day MA
The rule for buying and selling is simple:
- When Fast MA gets above Long MA (The green line crosses the red line on the way up) – this is a buy signal and you buy the financial instrument
- When Fast MA gets below Long MA (The green line crosses the red line on the way down) – this is a sell signal and you sell the financial instrument
Applying moving averages in fantasy football to identify the trend of player points
Let’s try something like this in FPL – on Salah’s points in the 2022/23 season. We calculate 2 moving averages in order to get a buy or a sell signal on Salah during the 2022/23 Premier League campaign.
I calculated two moving averages for Salah’s gameweek points from GW1 to GW38:
- Fast Moving Average – green line, 5-matches MA
- Slow Moving Average – red line, 10-matches MA
Here is the chart:
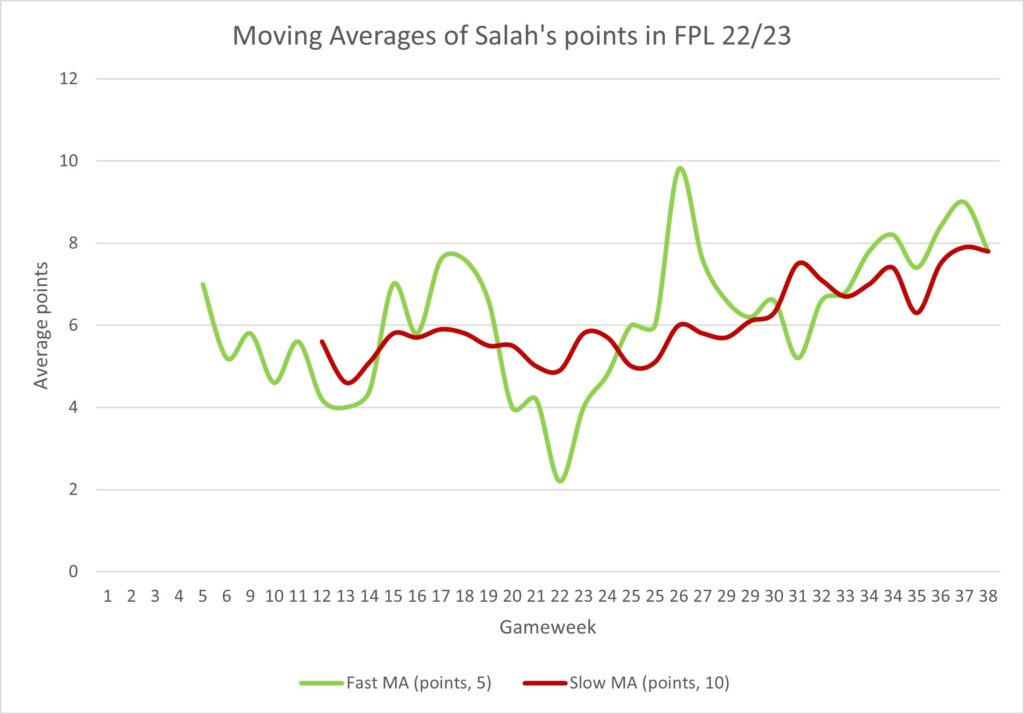
And here are the results:
- GW1 – GW10 – not enough data to own/or not to (because the 10-matches moving average is calculated from 10 matches, we needed to wait)
- GW11 – GW15 – no signal yet
- GW16 – GW20 – you buy Salah after GW15 and sell him after GW20, so you own him 5 matches, and get 4 points per match on average
- GW21- GW25 – you sell Salah after GW20, and do not own him for 6 matches when he averages 5.5
- points per match
- GW26- GW31 – you buy Salah after GW25 and sell him after GW31, so you own him 6 matches, and get 7.83 points per match on average
- GW32- GW33 – you sell Salah after GW31, and do not own him for 2 matches when he averages 4.5 points per match
- GW34- GW38 – you buy Salah after GW33 and keep him until the end of the season, so you own him 6 matches, and get 8.33 points per match on average
Summarized (without GW1-GW15, as there were no data or no signal):
| Matches | Points | Points per match | |
|---|---|---|---|
| When Owned After Buy Singal | 17 | 117 | 6.88 |
| When Not Owned After Sell Signal | 8 | 42 | 5.25 |
As we can see, the points per match average is higher in time when we owned Salah (after a buy signal) than when we not owned Salah (after a sell signal).
But the difference is pretty small, so it is likely not worth it to use transfers for this kind of trading. But there is clearly an opportunity to explore this option in greater detail on other players’ points.
This strategy could help in jumping on bandwagons when a trend emerges. But remember, moving averages carry information from the past, so they can tell you that strand changed only after it changed (for example after players started performing well). There is a great risk that once you receive a buy signal, it could be too late.
3. Stock prices and players’ points moves in waves (and clusters)
The stock market moves in waves. There is a concept called Elliot Waves Theory that is based on the idea that market prices follow repetitive wave patterns. According to Elliott’s theory, price movements in financial markets unfold in a series of waves, both upward and downward.
These waves are divided into two main types: impulse waves and corrective waves. Impulse waves represent the primary direction of the underlying trend, while corrective waves are temporary price movements that oppose the prevailing trend.
To show you what it looks like:
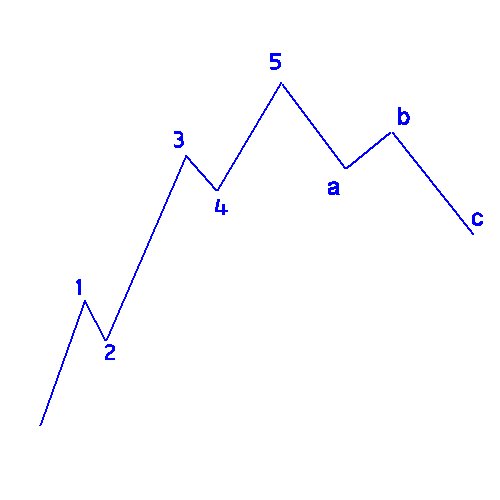
- 0-1 = Impulse Wave
- 1-2 = Corrective Wave
- 2-3 = Impulse Wave
- 3-4 = Corrective Wave
- 4-5 = Impulse Wave
- 5-a = Corrective Wave
- a-b = Impulse Wave
- b-c = Corrective Wave
All FPL managers must notice that players’ points are sometimes concentrated into a few gameweek – series of hauls (in-form) followed by a series of blanks (out-of-form). This could be explained by the statistical theory: The theory of clusters, which says that extreme values (in the FPL case “hauls“) occur in clusters.
However, I think there could be some analogy to the Elliot Wave Theory as well, especially, if we see multiple clusters of hauls in player’s performance over the season. Just look at Salah’s and Mané’s cumulative sum of goals and assists from the 2018/19 season:
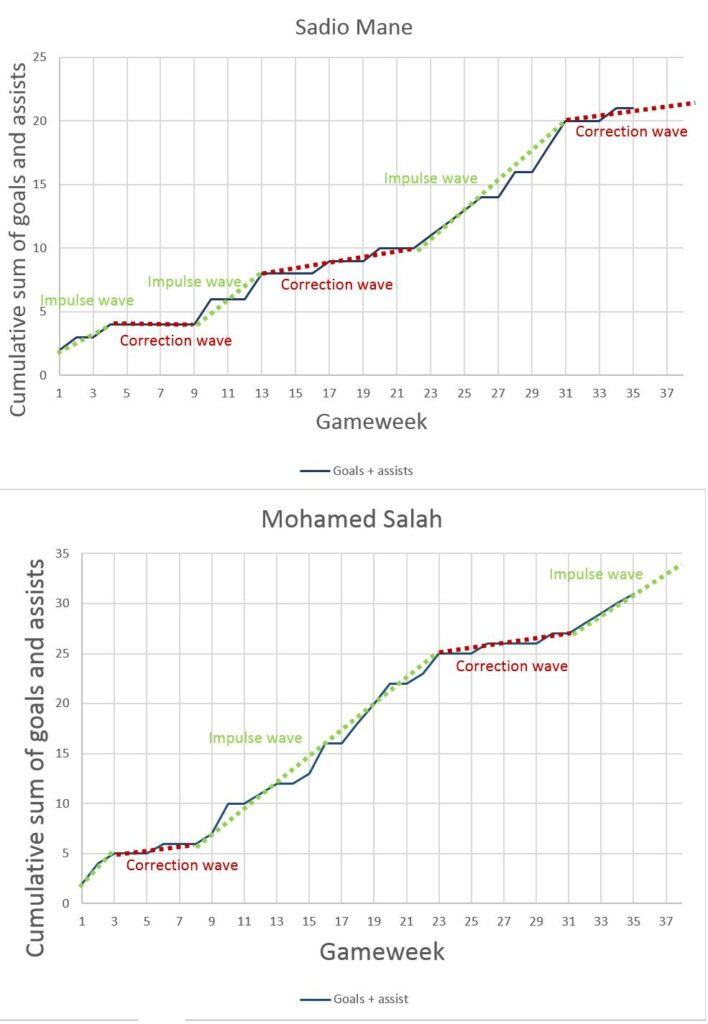
I will not go into much in detail with this, because I wrote a separate tweet about it a long time ago, you can check it out here:
#GW36 During this season I came to conclusion that there are many similarities between financial market and #FPL. I used some approaches, I am using in financial market, in FPL too, and I want to share some thoughts with you. There is chart of G+A for #Salah and #Mane from GW1-35 pic.twitter.com/DRZHJsdpV8
— Matej Šuľan 🇸🇰 (@ScoutMates) April 26, 2019
How the Elliot Wave Theory could be used in Fantasy Football?
It could help us identify “clusters” of hauls (the overperformance) so we know, after the series of hauls, there is going to be eventually a series of blanks (underperformance).
Examples:
Look at Haaland’s points from the 2022/23 season. After a few gameweeks when he was averaging more than 10 points per match, it looked like he was going to have a 400+ points season. But it was just a series of extreme values in a cluster followed by a long correction when his average points per match returned to the expected value (we could apply The Law of Large Numbers here).

So this concept should help us in:
- knowing that even if some heavy hitter is brutally overperforming, there is going to be a series of underperformance eventually
- it should help us prevent chasing the past performance
- when some cheap enablers emerge (like Almiron in 2022/23), the series of his hauls will likely be limited and the series of blanks will eventually follow
However, there is no way how to successfully predict how long the impulse and correction waves will last.
On the financial market, technical analysis experts use Fibonacci numbers to predict, how long should certain waves last. But it is very inaccurate.
The most common waves length in Elliot Waves theory are:
- 61,8 %
- 38,2 %
These numbers are derived from the Golden Ratio which occurs in everyday life more often than many might realize (Nautilus shell spirals, Sunflower seed arrangements, Pinecone scales, Leaf and branch arrangements in trees, Spiral patterns in hurricanes, Shape of galaxies, Human body proportions (e.g., ratio of height to navel to floor), etc..). You can read more about Golden Ratio on Wikipedia – it is perfectly explained.
So, let’s look at our examples:
Haaland 2022/23:
- Haaland’s 2 impulse waves (matches highlighted in green on the picture) occurred in 8+5=13 matches, which is 13/38 = 34,2 % (somewhat close to the Fibonacci number)
- Haaland’s 2 correction waves occurred in 65,8 % of matches (somewhat close to the Fibonacci number)
Sadio Mané (2018/19)
- The sum of correction waves length (the red lines combined): 21/38= 55 % (far away from Fibonacci)
- The sum of impulses: 17/38 = 45 % (the green lines combined) (far away from Fibonacci)
Mohamed Salah (2018/19)
- The sum of correction waves length: 13/38= 34,2 % (somewhat close to the Fibonacci number)
- The sum of impulses: 25/38 = 65,8 % (somewhat close to the Fibonacci number)
So, when it looks like a certain player is in a very long impulse way (like Almiron in the first half of the 2022/23 season), it could be time to consider selling him.
If a heavy hitter is in a very long correction wave (like Harry Kane at the beginning of the 2021/22 season), it could be time to consider bringing him in.
4. Correlations & finding lagging players
Imagine the situation in the financial market. You have a basket of very very similar stocks (for example gold mining stocks) from the same sector. There is very positive news coming for the whole sector (gold price rising = higher profits for gold miners) so the price of these similar stocks goes up.
Prices of many similar stocks from the same sector might correlate when something like this happens, and all go up and down at the same time.
Let’s continue with our example. One stock from the basket is lagging, its price did not move as a match as the others, despite it should have because of the change in external factors and growth in its intrinsic value.
So some investors (after doing deep due diligence on whether there are no other factors that might cause the lagging) buy this lagging stock as they expect its price should soon catch up to the price of other stocks from the same basket.
When applying this to FPL, we could use these correlations when we see that some team (for example Manchester City) is doing extremely well, crushing its oppositions and most of their players (Haaland, Mahrez, Bilva) are scoring points almost every gameweek. But there is one player (for example KdB) who is not getting many points – is lagging, despite having chances.
There is a potential to buy this player in expectation, that his points will catch up soon to the points of his teammates.
5. Looking for Asymmetries
Asymmetric investments refer to investment opportunities where the potential rewards or risks are not evenly balanced.
In other words, the potential upside or downside of an investment is disproportionately higher or lower compared to the amount of capital or effort required. Asymmetric investments occur when the potential rewards greatly outweigh the potential risks, or vice versa.
This can happen due to various factors, such as market conditions, technological advancements, regulatory changes, or unique opportunities.
When you find an opportunity for an asymmetric investment (they are extremely rare) it basically means that probabilities are in your favor (which is very rare).
So when you find this opportunity, you will obviously take it…Probabilities are on your side. You will lose on a few occasions (because probability is not 100 %), but over the long run, you will experience positive ROI, because of the law of large numbers.
It is like playing a malfunctioning roulette that was damaged and now the probability of rolling the zero is not 1/37 = 2.7 % but let’s say 10 % without the casino noticing. Of course, you would bet on 0 every time. You would lose 9 out of 10 times, but once you hit it, you win big.
But let’s finally move to the point.
Look for asymmetric opportunities in Fantasy Premier League.
For example, it could be mispriced (underpriced) players. Do you remember when Haaland (when playing for Salzburg) was 4.5m forward in UCL Fantasy and banged a hattrick on Matchday 1? Or when Mbappe (when playing for Monaco) was 5.0m midfielder and was scoring in almost a match? Or Mahrez and Vardy from Leicester winning season?
Those were all asymmetries and you had to own those players.
Look for asymmetries among underpriced players, such as Rashford or Martinelli from 2022/23 season.
6. Nothing matters if you do not manage risks properly
None of the above, no fundamental analysis, and no technical analysis can bring you success in the financial market unless you have a bulletproof risk management strategy.
The same goes for FPL.
I cannot stress this enough. You need to have a risk management strategy in place if you want to succeed in Fantasy Football.
Accept that you cannot predict the future. You cannot predict goals, assists, injuries, suspensions, or form (fixtures are the only thing you can predict).
That’s why you have to manage risks.
If someone tells you in the financial market that, for example, uranium stocks are the only next “sure thing”, he is lying. Because he cannot predict the future.
So, you never go all-in in “sure things”. Never. It could be an asymmetric investment, and after your due diligence, you could invest in that sector. But there is no such thing as a “sure thing”. You always have to protect your portfolio, spread and minimize risks.
In FPL, you could do:
- You must find a balance between diversification and concentration – diversification protects wealth (FPL points) and concentration creates wealth (FPL points). In the long run, diversification always wins. There are times when you need to diversify spots in your FPL squad into players from multiple teams. However, FPL season is not very long and there are times when you need to concentrate 3 of your fantasy squad spots on players from the same team (Manchester City, Liverpool…). Just do it wisely. If you overdo it in concentration, you might be in trouble in the long run.
- You must control your emotions – there is no other option. You cannot win in the stock market if you trade by feel, or just because the stock went up and you have a FOMO. If you missed an opportunity, you missed it – accept it, do not make rage transfers and emotional decisions you would regret later. Do not chase the past, focus on the future.
- Prepare your decision-making process and system on how you will react when you feel the need for chasing past points, and ALWAYS obey this system. Systems and processes for decision-making are invaluable for successful investing (just read Ray Dalio’s book – Principles). If you have a decision-making process/system ready and you apply it when making transfers or deciding on chips, it will help you eliminate your emotions from the equation. Imagine the decision-making system like rules you always obey or sequences of if statements. For example: If X happens, I will do Y… “If my player is out only for one gameweek, I will keep him on the bench.” “I will always make my transfers on Friday when I have all information from press conferences.” “I will never captain a budget player (below 7 million), because they are not reliable, unless we are in a double gameweek.” Etc…
- Eliminate losses – avoid -4 points when possible. Use them only when absolutely necessary.
- Manage your team like a stock portfolio – transfers and chips are precious resources, use them wisely and strategically
- Do not rely on luck, rely on probabilities
In both FPL and the financial market, risk management is about making strategic decisions to balance the potential for high returns against the possibility of losses. It involves a careful analysis of the risk-reward trade-off and the ability to make informed decisions under uncertainty.
We have a separate article on risk management in FPL, you find it here: Managing risks in FPL.
7. Information, information, information
I will touch on this obvious similarity only shortly…
You need to have correct information in order to succeed in financial markets and in fantasy football as well.
Always do your own due diligence when researching stocks (players). Stay up to date with players’ injuries and their availability. Because there always be many FPL managers and casual FPL managers who do not do it. And this is your opportunity how to gain an advantage over them.
There always be an asymmetry in the information Fantasy Premier League managers have. Some managers might get that 10-minute pre-deadline leak that Haaland is benched and others might not. And if you get that information while the majority do not, you will be an obvious advantage. To finish up with stock market similarities, it is almost like insider trading.
Conclusion
There are many similarities between the stock market and fantasy football. Understanding how the financial market works could help you succeed in Fantasy Premier League. As we noticed in this article, there is definitely room for some stock market strategies to be implemented into our decision-making process in Fantasy Football.
![3 Best Captain Picks for FPL GW33 [Captaincy Index] fpl best captain picks](https://www.fantasyfootballreports.com/wp-content/uploads/fpl-best-captain-picks.jpg)
